i would like to give some description about my symbol as below :
The Shape:
1. factory - It is a major things that cause of air pollution. When we heard air pollution, it must related to factory.
2. smoke - came out from factory and causes air pollution.
3. earth - Its the earth!!!
4. eye in the earth - Shows the earth needs our help to recovered its original state.
The Colour:
1. blue( factory) - Unity. Shows all the people in the earth need unite to save our
earth.
2. blue( earth) - The parts of sea in the earth that haven get pollution.
3. black and grey( smoke) - Prove that it cause air pollution very seriously.
4. grey( earth) - The parts of earth that already get a seriously pullution.
5. green - The parts of jungle in the earth that haven get pollution.
Monday, July 21, 2008
Saturday, July 19, 2008
my global warming's symbol

This is my first step when drawing my symbol.
I will use air pollution as my topic.

This is my first step drawing my symbol.
I used a factory because the majoring causes of air pollution is factory.

This is the second step of my symbol.
The factory comes out with so many smoke and causes air pollution.

This is my final product.
The earth is pollute by the smoke that comes out from the factory.
All the things there i draw with pen tools including the circle.
Monday, July 7, 2008

Friday, July 4, 2008
Background reserch of global warming 2

According to scientists at the University of Washington, the Pacific Northwest has gotten warmer by 1.5 degrees since 1900, about a half-degree higher than the global average. Since 1949, snowpack in the lower mountain range, a primary source of water for the area, has declined 50 percent, raising the odd specter of water shortages in the rainy Pacific Northwest. More water is falling as rain--and being lost as runoff--and less is falling as mountain snow, a natural banking system that holds the precipitation until the spring, when it melts to fill reservoirs for the dry summer season. The problem snapped into focus over the past two years, when the state was hit by a severe drought--the kind of extreme weather fluctuation that scientists expect will become more common as temperatures climb. It's a question haunting the 58-year-old Sims, who has made fighting the effects of climate change a central theme for much of his 10-year tenure as county executive. Even if people everywhere unplugged their appliances, left their cars home, and 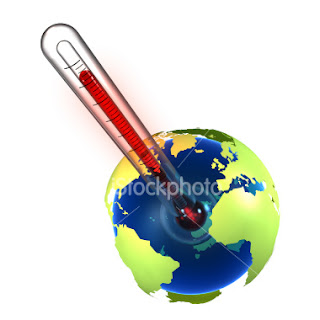 shuttered their factories today, enough fossil fuel emissions are already in the atmosphere to heat up the planet an additional 1 degree Fahrenheit this century, experts say. In reality, however, emissions are increasing--and scenarios put the likely temperature increases at 2.5 to 8 degrees over the same span. While politicians wrangle over mitigation.
Last year, 2001, was the second warmest year since recordkeeping began in 1867. Following the all-time high of 1998, last year's near-record extends a strong trend of rising temperatures that began around 1980. The 15 warmest years since 1867 have all come since 1980.
 shuttered their factories today, enough fossil fuel emissions are already in the atmosphere to heat up the planet an additional 1 degree Fahrenheit this century, experts say. In reality, however, emissions are increasing--and scenarios put the likely temperature increases at 2.5 to 8 degrees over the same span. While politicians wrangle over mitigation.
Last year, 2001, was the second warmest year since recordkeeping began in 1867. Following the all-time high of 1998, last year's near-record extends a strong trend of rising temperatures that began around 1980. The 15 warmest years since 1867 have all come since 1980.
Background research of global warming

Earth's average temperature is becoming warmer. Because atmospheric warming will be most readily apparent in the melting of perennial and permanent ice, and because most glaciers are small relative to vast ice sheets and expansive sea ice, glaciers are important indicators of climate change.
- Over the past 100 years, global mean (average) sea level has been rising at an average rate of 1 to 2 millimeters per year. A possible contributor to sea-level rise is increased meltwater from the snow and ice of glaciers, ice sheets, ice caps, icebergs, and sea ice.
- Glaciers in Alaska and neighboring Canada, with a combined area of approximately 90,000 square kilometers (roughly 35,000 square miles), and accounting for about 13 percent of mountain glaciers on Earth, have thinned substantially. Over the last 40 years, thinning has been on the order of 50 to 100 meters (several hundred feet) at lower elevations of glacier occurrence, and about 18 meters (60 feet) at higher elevations.
- Many glaciers in South America's Andes are melting so fast that, if the current rate continues, they could disappear by 2020. The Quelccava glacier in Peru retreated 32 times faster during the period 1983–2000 than in the 20 years from 1963 to 1983. In the Patagonian ice fields of Argentina, glaciers have receded 1.5 kilometers since 1990.
- In Africa, Mount Kilamanjaro's ice fields have shrunk by a least 80 percent since 1912. Mount Kenya's ice cap has shrunk by 40 percent since the 1960s.
- The 15,000 glaciers of the Himalayas, which collectively constitute the largest body of ice outside the polar caps, are reported to be receding faster than anywhere on Earth. Some 2,000 have melted since the 1950s. Instead of snow accumulation in winter, Himalayan glaciers are being hit by summer monsoon rains. The Dokriani Barnak glacier has receded about 0
 .8 kilometer since 1990. If Himalayan glaciers recede at this rapid rate, they will be gone by 2035.

In the European Alps, several glaciers have disappeared entirely since the 1960s.
Permanent sea-ice cover in the Arctic Ocean is shrinking by an area the size of the Netherlands each year. The Arctic ice cap thinned from 3 meters (10 feet) in 1970 to 2 meters (nearly 7 feet) in 2000.
- In the Antarctic, rising temperatures have resulted in the collapse of massive ice shelves, some of which have been there for 20,000 years.*
- In Glacier National Park in Montana, the number of glaciers has dropped from an estimated 150 in 1850 to only 50 in 2000. At this rate of decline, all of the glaciers in the park will be gone by 2030.
Subscribe to:
Posts (Atom)